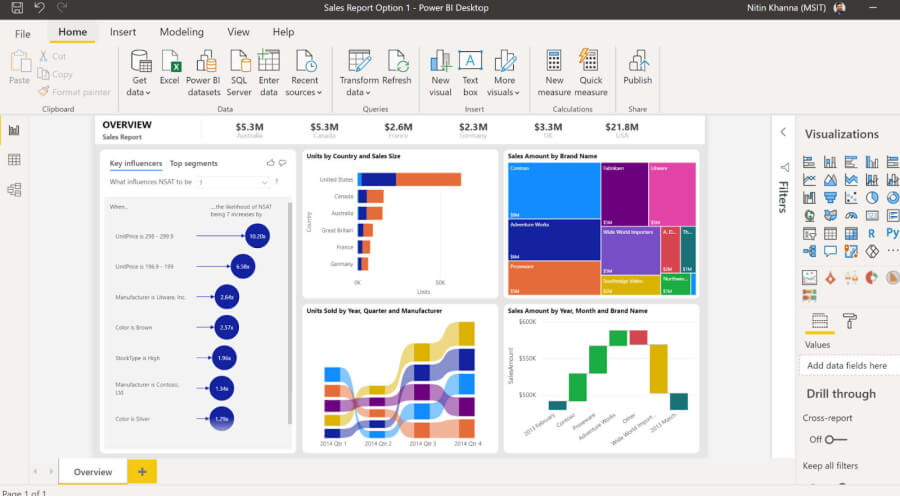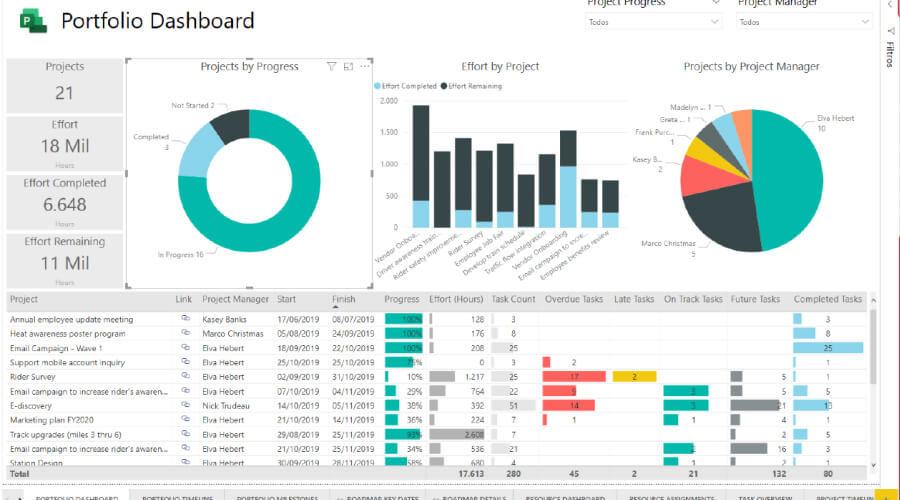
Visualizing data and forming reports are vital to a growing business. It tells where the business is currently standing and whether they’re making progress. However, data visualization can be a bit tricky to do at times, but there are tools to help you with that. Shortly, you’ll get to know the Power BI platform and how to make use of it to its maximum potential.
Introduction to Power BI
Before proceeding any further, you’ll have to know what Power BI is. The Power BI tool is a unified and scalable platform for businesses. This powerful tool is capable of linking and visualizing data. It’s also capable of forwarding the visualized information to the apps that you use every day.
How to use Power BI to its fullest?
Power BI has a reputation for being easy to learn but requires you to understand its variety of features. These features would allow you to maximize the use of the platform for your data reports. However, it’s best that you take up Power BI training in this case. You’d want to learn more about the technical parts of the platform for an optimized experience.
To take full advantage of these features, it’s essential to familiarize yourself with Power BI Report Builder, a robust tool designed for creating custom reports. By mastering the capabilities of Power BI Report Builder, you can design and customize visualizations to suit your needs, making your data presentation more effective and engaging.
There are a lot of tips and tricks that you can use to create an optimized user experience in a Power BI tool. Utilizing these strategies can form an unforgettable report that your company can see. Listed here are the many ways you can optimize your data visualizations. Here they are, as follows:
1. Visualize your utilized services
The good news is that Power BI has a lot of integrations. You can link it up with Salesforce and other analytic services. Bring the data from them into your customized dashboards. Then leave it to Power BI to explore those data sets and visualize them properly.

2. Drive AI machine learning
The Power BI platform has one useful perk, and that’s machine learning via its Dataflow. Dataflow from Power BI doesn’t only act as storage for data sets. It is also utilized in automating the preparation of data sets and enriching them! The added perk of this is that, unlike other similar tools, it doesn’t require a subscription.
3. Utilize AI-powered Power BI visualizations
Usually, data visualizations would require the employment of a data scientist. Power BI functions as a data scientist by identifying factors that influenced the data. The AI of this platform will analyze and detect all changes over time. It also has smart narratives that automatically generate text that tells the story behind the data.
4. Tell a story with your data
Once you have your data sets stored and nurtured by Power BI, you can tell a story about them. Through the use of Timeline Storyteller, you can visualize data changes over time. Make sure to pick the most appropriate form of visualizing the said data, whether a chart, a pie graph, or the like.
5. Use customized visualizations
The Power BI tool houses a plethora of custom visualizations. All of them are designed to go well with your data sets. You need to download them from the Office Store, though. You can also create personalized visualizations via their custom visual tool.

An additional note regarding this is that you can also link Microsoft Visio diagrams as a customized form of visuals.
6. Ask questions, and answer in your own words
Another fun feature that Power BI platforms have is their natural language feature. You can ask questions, and it responds with visualizations. Specify and ask, tell it how it should be presented, and you’ll get it right away!
7. Make the data dynamic, make it run in real time!
You will need to have access to real-time streaming data to make it work. You can extract data from e-commerce sites or other places that have sensors. This, however, requires you to link up with a streaming analytics tool. The result is data that’s dynamic and changes over time.
These are the tips on how to get the most out of Power BI. Now that you’re familiar with some useful tips, go on and create great reports with the tool. Take note that you should set up security settings in Power BI so that any critical data will be secured.
The Bottom Line…
The Power BI, made by Microsoft, is a powerful tool that makes report generation even more convenient. By providing it the information that it can keep and nurture, you can use them to form data sets. These data sets will then be used to form very dynamic visualizations of data. Power BI can then create predictions based on the report it made.
While it is easy to use, it does have a lot of functions that you need to fully understand. You’ll need to take the tips provided here to heart. You will also need to take up Power BI training to know the more in-depth details of the tool. Once you’ve mastered the information from both, you’re set to form dynamic data reports for your company.
FAQs regarding Power BI
1. What are the benefits of utilizing Power BI?
The main benefit of utilizing Power BI is that you can visualize the data that it provides. The said visualized data can then be shared across the company. As for the AI, it is capable of performing queries on reports with the use of simple English words.
2. Can you explain what Power Query is?
This is the AI designed by Microsoft for Excel. It allows you to import data from a variety of sources. The data can then be cleaned and transformed according to what you want to use them for.
3. Can I utilize very large data files?
If it exceeds 1 GB, then you won’t be able to use it on Power BI. It has to be smaller or exactly 1 GB if you want these data sets to be workable on the platform.
4. Can you explain what is SSBI?
SSBI is an abbreviation. It is fully known as “self-service business intelligence”. It is best described as an AI in Power BI that allows report generation and forms predictions based on the data provided. Even the least technical people can use Power BI without much issue.


![8 Best Data Visualization Tools you must know [Free and Paid] 8 Best Data Visualization Tools you must know [Free and Paid]](https://www.weetechsolution.com/wp-content/uploads/2024/09/Best-Data-Visualization-Tools-300x150.jpg)


