Handling errors and debugging in Node.js applications is essential to engage the right performance and user experience. For developers or Node.js Development services, it is crucial to understand advanced techniques to establish how best to streamline the processes, decrease time wastage, and improve the application stability. This blog discussed five important issues which include error handling, logging, error tracking, debugging, and performance monitoring.
Why is Advanced Error Handling Crucial in Node.js?
As a common use of Nodejs, different applications perform asynchronous operations, making errors difficult to locate. Lack of a good error management plan results in disappointments where problems build up, and the system can either stall, slow down, or frustrate the users.
As for different companies and developers dealing with Node.js development, it is critical to adhere to the best practices in the field of debugging and errors.
Error Handling Strategies in Node.js
1. Using Try-Catch Blocks

Try catch blocks are among the most basic approaches to handling errors in Node Js as a programming language. This method fills the requirement for capturing synchronous errors within a certain area of code.
➢ Example:
try {
  const data = JSON.parse(userInput);
} catch (error) {
  console.error("Error parsing JSON:", error.message);
}
- Use try-catch to wrap operations like JSON parsing, file I/O, or other critical synchronous processes.
2. Custom Error Classes
Creating custom error classes, this can be greatly beneficial when working with errors to give options for trying to categorize them.
➢ Example:
class ValidationError extends Error {
  constructor(message) {
    super(message);
    this.name = "ValidationError";
  }
}
throw new ValidationError("Invalid user input");
➢ Benefits:
- Clearly define the type of error.
- Enable centralized error handling for specific error categories.
3. Handling Async Errors
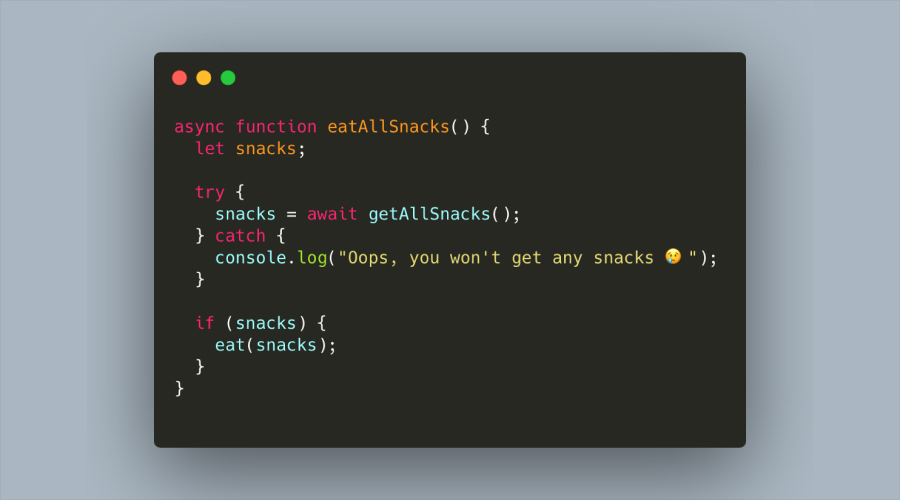
Node.js applications often rely on asynchronous operations. Handling errors in these cases requires tools like async/await or Promise.catch().
➢ Example with Async/Await:
async function fetchData() {
  try {
    const response = await fetch("https://api.example.com/data");
    return await response.json();
  } catch (error) {
    console.error("Error fetching data:", error.message);
  }
}
➢ Example with Promises:
fetch("https://api.example.com/data")
  .then(response => response.json())
  .catch(error => console.error("Error fetching data:", error.message));
Also Read: Node Js Interview Questions
Logging in Node.js Applications
Screen output or logging is especially for monitoring the running behavior of your application or during debugging. The advantage of employing structured logging frameworks favors consistency and a clear format.
1. Introducing Winston
Winston is one of the most beloved logging Libraries in Nodejs. It provides multi-log levels, transports (file, console) and forms.
➢ Example:
const winston = require("Winston");
const logger = winston.createLogger({
  level: "info",
  format: winston.format.json(),
  transports: [
    new winston.transports.File({ filename: "error.log", level: "error" }),
    new winston.transports.Console({ format: winston.format.simple() }),
  ],
});
logger.error("This is an error message");
2. Using Bunyan
Bunyan is another robust logging tool, focusing on structured logging with a JSON output format.
➢ Features:
- Easy integration with other tools.
- Suitable for production environments.
➢ Error Tracking with Tools like Sentry
Applications such as Sentry give you an immediate view of unhandled errors and exceptions that occur in your application.
➢ Integrating Sentry
- Install the Sentry package:
- npm install @sentry/node
➢ Configure Sentry in your application:
- const Sentry = require(“@sentry/node”);
- Sentry.init({
- dsn: “https://examplePublicKey@o0.ingest.sentry.io/0”,
- });
- Sentry.captureException(new Error(“Test error”));
➢ Advantages:
- Automatic error logging.
- Detailed stack traces.
- Integration with version control and deployment pipelines.
Also Read: Difference Between AngularJs and NodeJs
Debugging Node.js Applications
Debugging tools play an important part by helping a developer find problems and their solutions during the development and deployment stages.
1. Using the Built-In Node.js Debugger
Node Js provides a built-in debugger that can be accessed using the inspect flag.
➢ Example:
- node inspect app.js
- Use commands like n (next) and c (continue) to step through code.
2. VSCode Debugger
Visual Studio Code offers an integrated debugger for Node Js. By adding a configuration in launch.json, you can set breakpoints, inspect variables and monitor runtime behavior.
➢ Steps:
- Go to the Run and Debug view in VSCode.
- Click “Create a launch.json file.”
- Configure the debugger with:
{
  "type": "node",
  "request": "launch",
  "name": "Debug App",
  "program": "${workspaceFolder}/app.js"
}
3. Node Inspector
Node Inspector is a standalone debugger for Node.js native addons that integrates with Chrome DevTools for a graphical debugging interface.
➢ Steps to Use:
- Install Node Inspector:
- npm install -g node-inspector
- Run your application with:
- node –inspect app.js
Also Read: NodeJs Security Best Practices
Performance Monitoring in Node.js
Monitoring performance is essential for detecting runtime issues, memory leaks or slow operations. Tools like PM2 and New Relic provide comprehensive insights.
1. Using PM2
PM2 is a process manager that includes performance monitoring features. It helps manage Nodejs applications in production with features like process restarts and CPU profiling.
➢ Example:
- pm2 start app.js –watch
- pm2 monit
2. New Relic
New Relic offers detailed performance insights, including transaction traces, database monitoring and error analytics.
➢ Steps to Integrate:
- Install New Relic:
- npm install new relic
- Add the configuration file newrelic.js to your project and set up your account credentials.
Also Read: Node JS App Development Tips
Conclusion
Managing the failures and bugs in Node.js is a rather intricate process, but introducing error control in application creation is essential. With these methods and great tools like Winston, Sentry, and PM2, the Node js developers and the Node.js Development company can have the best practices to get error-free incredible performance applications. These techniques need to be prioritized to support fuller and higher quality experiences for customers.
FAQs
Q.1 What is the role of a logging framework in Node.js?
Frameworks such as Winston and Bunyan create format logs that are quite useful especially when creating or trying to understand an application breakdown.
Q.2 How does Sentry enhance error tracking in NodeJs?
Using Sentry, unhandled errors are captured alongside detailed stack traces and alerts, to eliminate resolution time.
Q.3 What is the best way to debug asynchronous errors in Node.js?
Asynchronous/await with promise or try-catch blocks.Catch() guarantees elegantly handling asynchronous mistakes.
Q.4 Why should a Node Js Development company use PM2?
PM2 provides the capability to manage, monitor, and automatically restart processes which enables it to run production applications.
Q.5 Can New Relic monitor application performance in real time?
Yes, New Relic has features that allow the monitoring of transactions, errors, and database response times in Node.js apps.


